NLP analysis of the Bitcoin share price
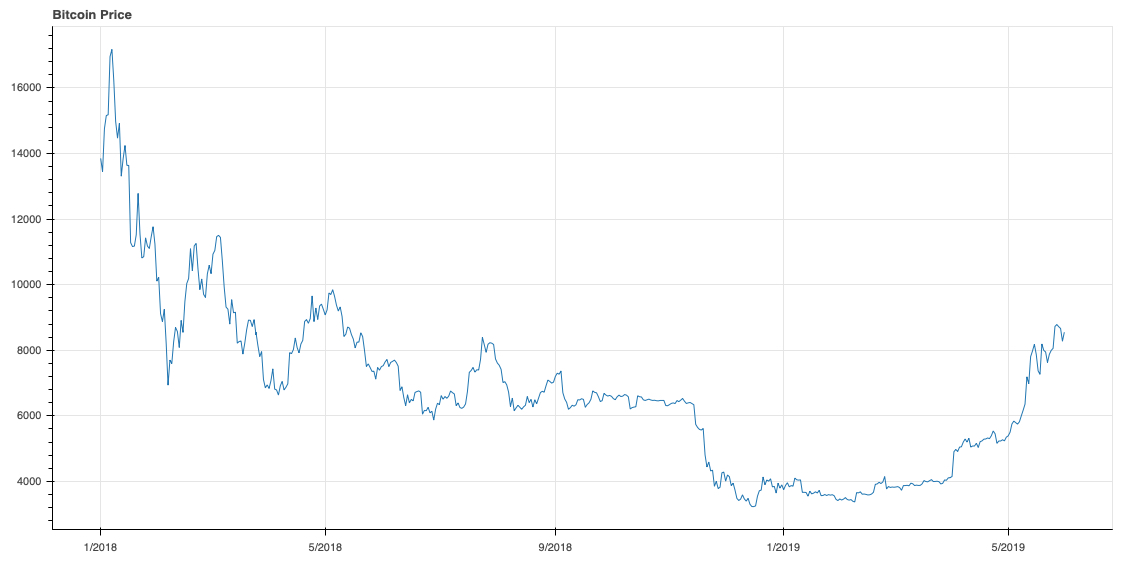
The business challenge is to predict the Bitcoin share price. The estimation of this currency is especially difficult (and therefore also interesting) because of its high volatility.
The Bitcoin share price value has been shown in the enclosed figure (starting from 1/1/2018).
In this Natural Language Processing (NLP) modeling, one has to make the following considerations and decisions:
- Choose the research topic (here Bitcoin).
- Choose the social media channel(s) you want to follow or listen.
- Choose the sources of the information within the media. In many cases, most of the social media feeds are not relevant to the topic you are investigating. Valuable sources can be, for example, some persons who are specialists in their fields and who are active providing good data, facts and insight to the social channels. ”Thought leaders” or ”speaking heads” are not necessary these, if they are not writing down all the information they know and/or sharing it in the channel(s) you are using.
- We need to distinguish messages provided by the machines and trolls. Also, it is very probable that some (or most) of the sources are such that you are not familiar with them earlier, and it requires some research to find them out.
- Choose the NLP algorithm that is used in analysis (Here we have used the Vader sentiment analysis. Some other algorithm would probably provide more accurate results, but this was a starting point. And a more important is that there is some systematic way to do the analysis than the algorithm itself.)
- Choose the languages within NLP you are using (Vader makes machine translation and therefore the results are reliant not only upon the accuracy of the sentiment analysis tool but also the accuracy of the translation tool).
- Define the NLP threshold values.
- Define the time window you want to investigate.
- Define the tags you are searching in the social media feeds (here we have two keywords bitcoin and crypto).
- Define the minimum and maximum number of feeds of the source you accepting to the analysis. For example, if a ”good” source provides over 500 feeds in a year, it is very probable that not all of them are relevant.
- Finally, if you want to have good visual correlation of the results, this may require some tuning.
This exercise was made in two weeks with open source tools and open data. The analysis was based on about 700 data sources and 17500 data points, and the raw data was having 1850000 data points. The NLP analysis result is shown in the enclosed figure.
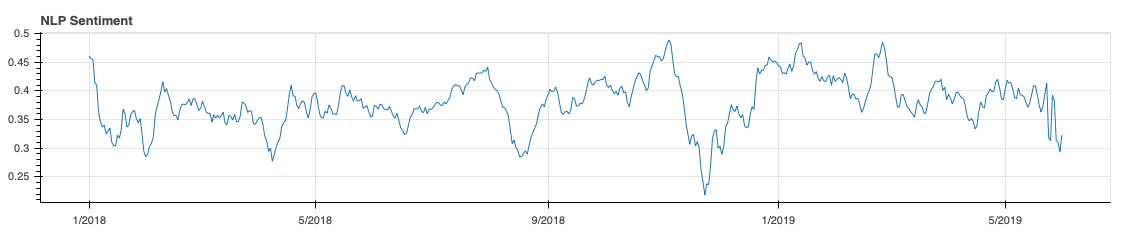
One can see from the figure that the peak correlations are matching (and occuring nearly at the same time or before than the event itself), like the fall in 11-12/2018. There are still a lot that could be made to improve the result, for example,
- Reduce the noise (i.e. remove some not so good sources).
- Add more good sources and data points.
- Tune the threshold values.
- Consider other options for Vader and improve the non-English support.
- Look at the output from other social media channels which can strengthen the weak signals.
- and so on..
In this specific example we were also able to extract the high-level geographic location information of the sources. This result is shown in the enclosed figure.
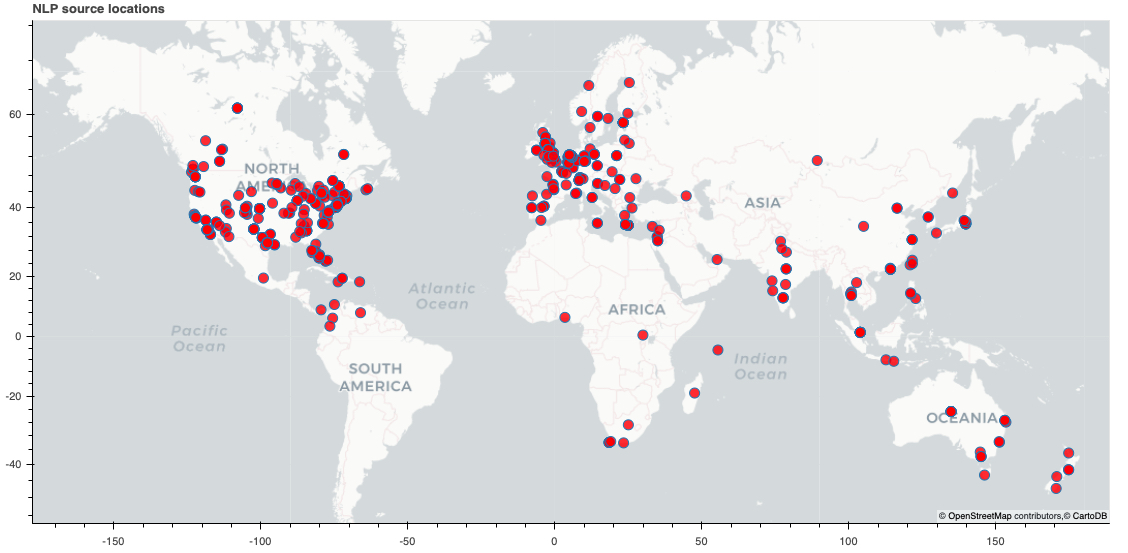
Interesting results that could be further analyzed. A lesson learned is that the social media is an excellent source to track almost any event in real time. If for example, one wants to follow company's performance, whatever happens for the company the news are first in the social media network and spread there in real time.
More topics on Machine learning.