Computer vision in technical data analysis
In this example we apply tensorflow and keras to share price analysis. Tensorflow is an open source platform for machine learning, and keras is a high-level neural networks library. Together they can be used, for example, in visual data algorithms.
The share price histogram is divided into time windows as shown in the enclosed figure. The full graph is
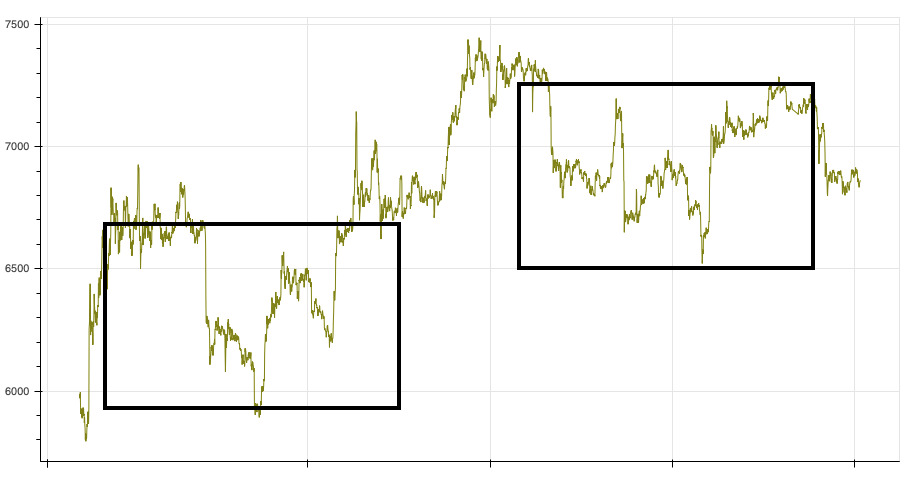
and the windows that are extracted from the graph are, for example,
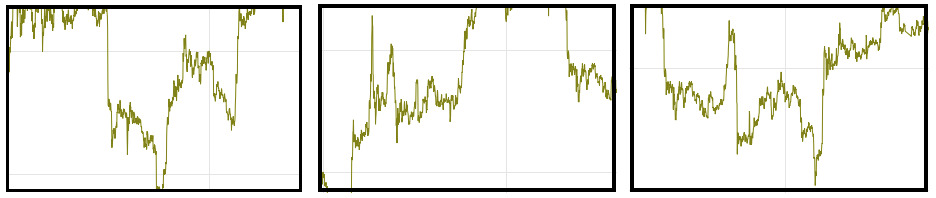
The predicition capability depends, for example, on the length of the histogram, the number of the samples that are used in the calculation and the possible patterns in the graph. Typically it is good to have a minimum of 30000 samples. The model accuracy can be over 90% depending on the graph and how the initial conditions are set.
More topics on Machine learning.