Autonomous learning investment algorithm
The information presented in this section should not be used as a basis for investment decisions. The information in the graphs below are delayed by purpose.
The business challenge is to predict the Bitcoin share price in real-time. Here we forecast the relative changes of the BTC course. The algorithm is fully autonomous and corrects itself. The model itself is simple and it is described in the following figure.
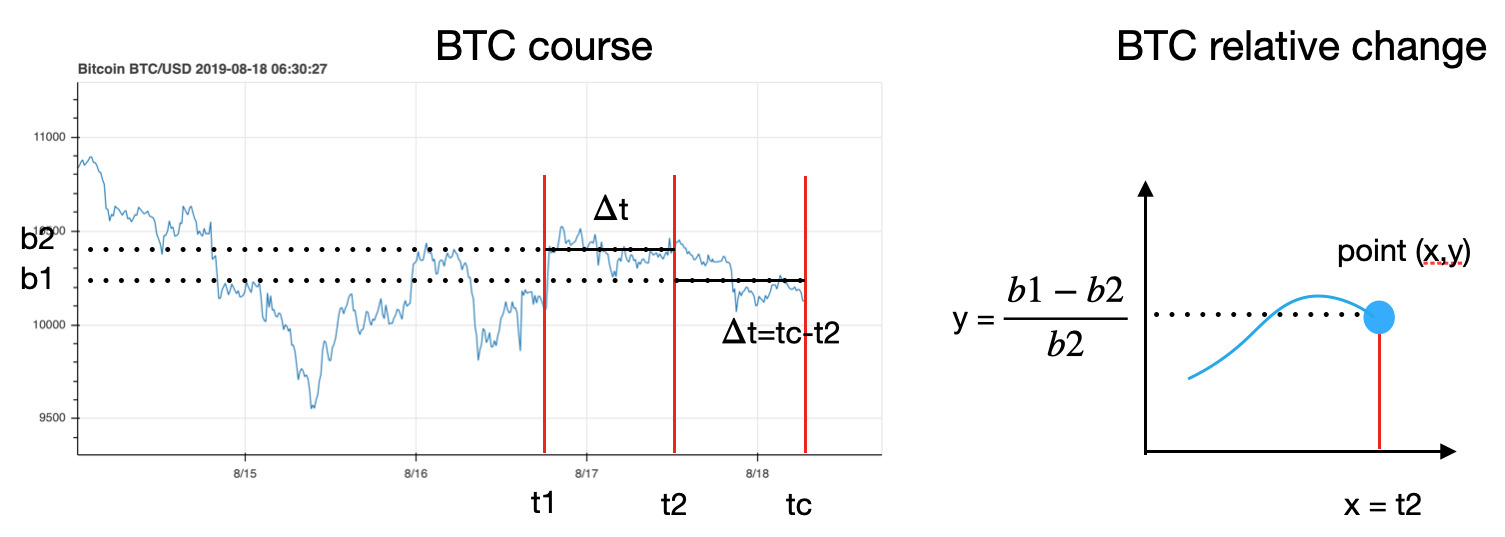
We consider a short time interval, let's take as an example 6 hours (delta t = 6). Data point tc is the "current time", t2 is a time point 6 hours earlier and t1 is a time point 12 hours earlier. We calculate the BTC course average, b1, between the times tc-t2, and b2 is the BTC course average between t2-t1. From these values we plot a figure, where y=(b1-b2)/b2 at the time point t2. When doing like this, the graph is always delayed 6 hours compared to the current time.
Next we use the data from the internet (social media data, facts and other data) and calculate the future prediction for the next hours (in the previous example case 6 hours ahead) and forecast the average BTC ratio for the interval tc-t2. The new calculation or prediction is made every 15-30 minutes. The results are shown in the subsections below.
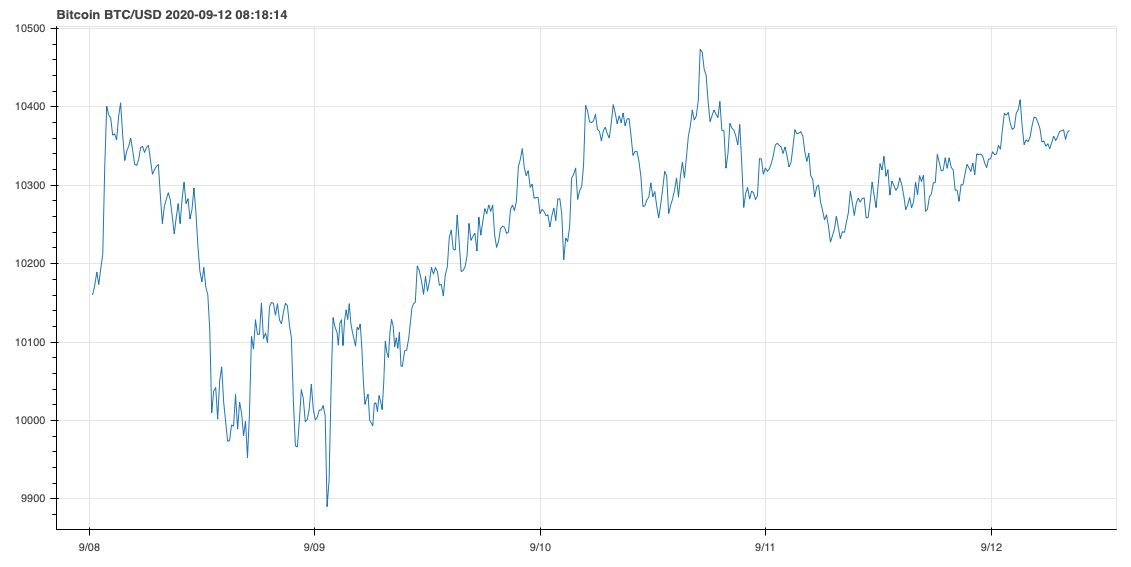
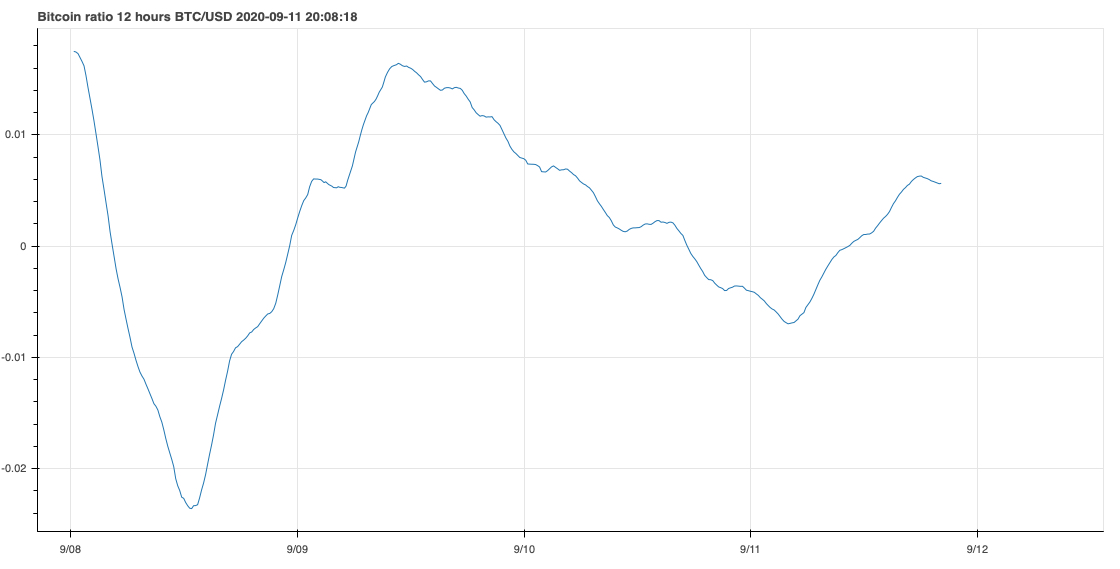
First we plot the BTC course rate in real-time (there is a delay of 15-30 minutes by purpose).
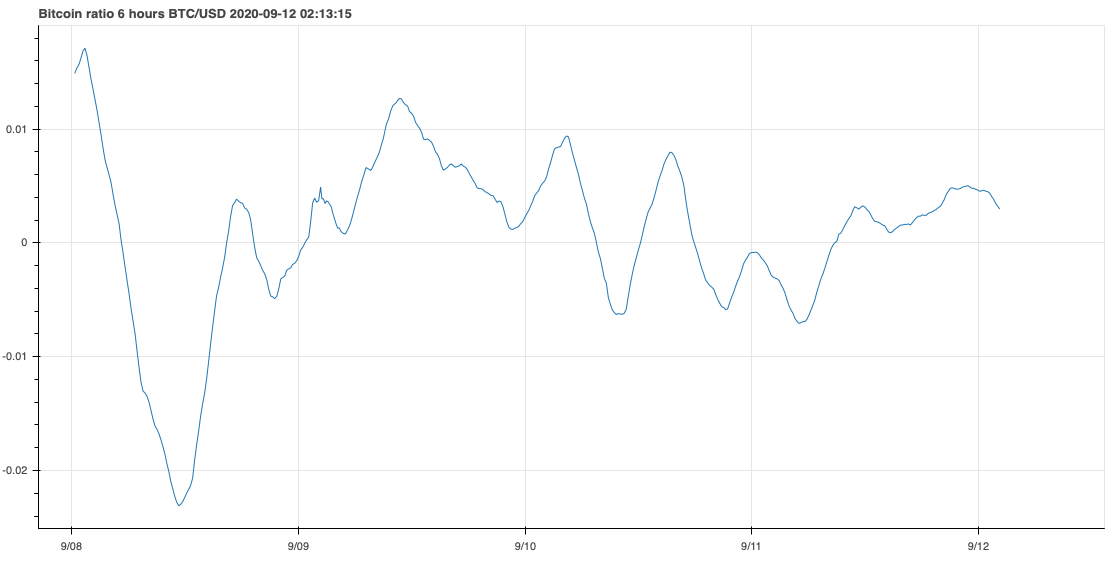
Estimate for the next 6 hours
In the first example, the time period delta t is 6 hours. The average of the BTC ratio is shown in the enclosed figure. When the line crosses a zero point, this means that the BTC course changes its direction from positive to negative or from negative to positive. The magnitude of the change is seen as a size of the peak hight.
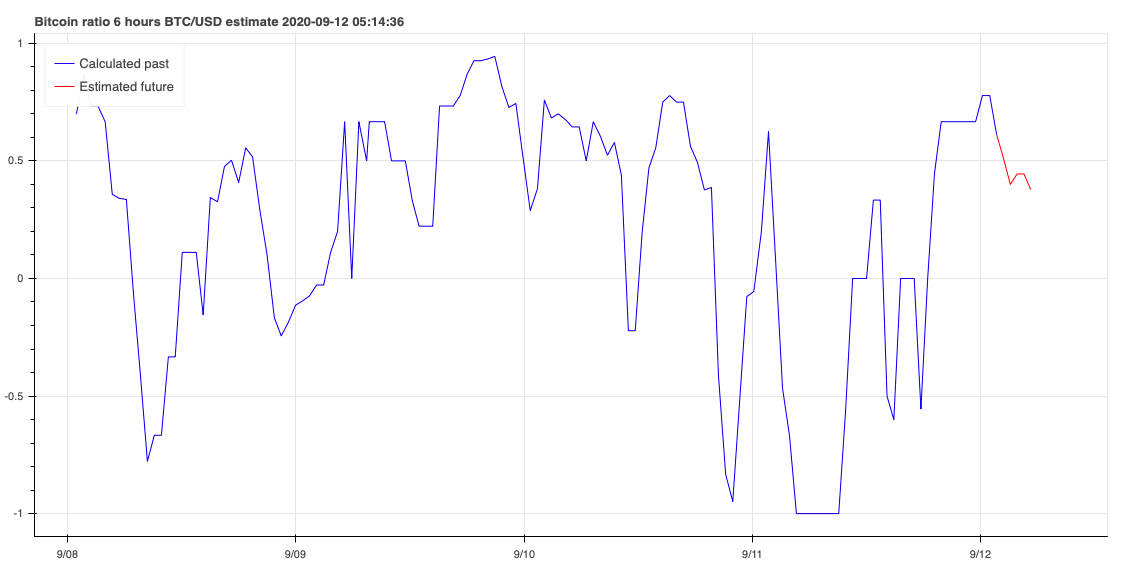
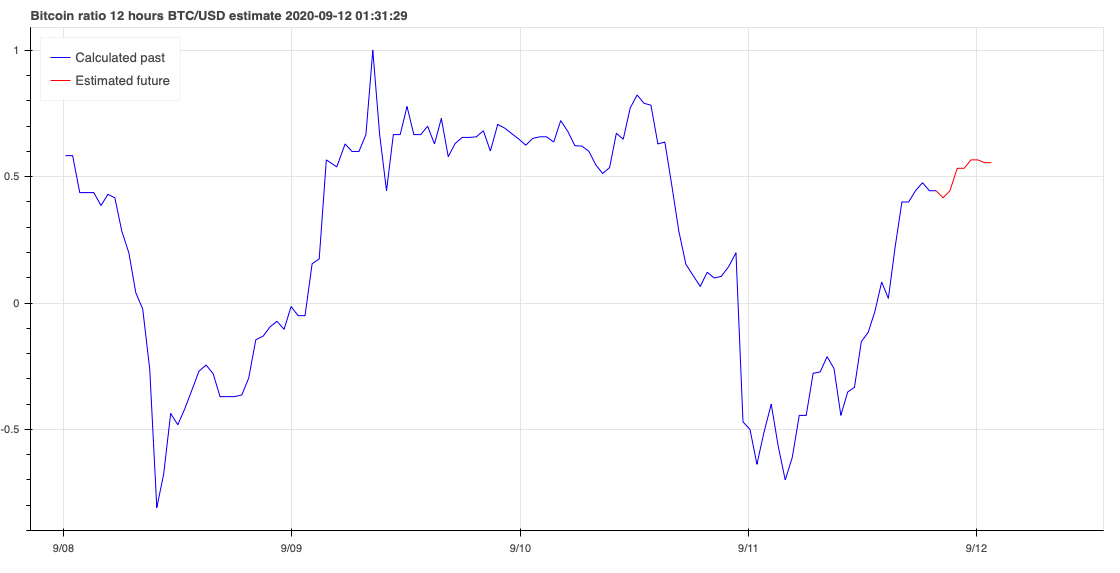
The estimate for the BTC course ratio with 6h is shown in the figure above. Now the time when a new prediction is obtained is 3 hours ahead, tc+3h (=tc+6h/2). The calculated (relative) results in the past are shown in blue and the estimated new values are shown in red. Interesting points to check are whether the shape of the estimate is resembling the BTC average ratio (the previous figure), and more precisely, whether the zero poinst exist at the same time points. This would mean the change of the sign of the BTC course. Also, if the plot in the figure between the time period tc+3h is positive, this means that the BTC course on average goes up in the next 6 hours.
The point we want to empasize here is that the prediction is based on the calculated result, and especially, the results are not derived from the BTC course. So even if the shape may resemble the actual BTC course behavior, it is the calculated result.
Estimate for the next 12 hours
The BTC average ratio for the next 12 hours is shown in the enclosed figure.
The ratio estimation for the next 12 hours is shown in the figure above.
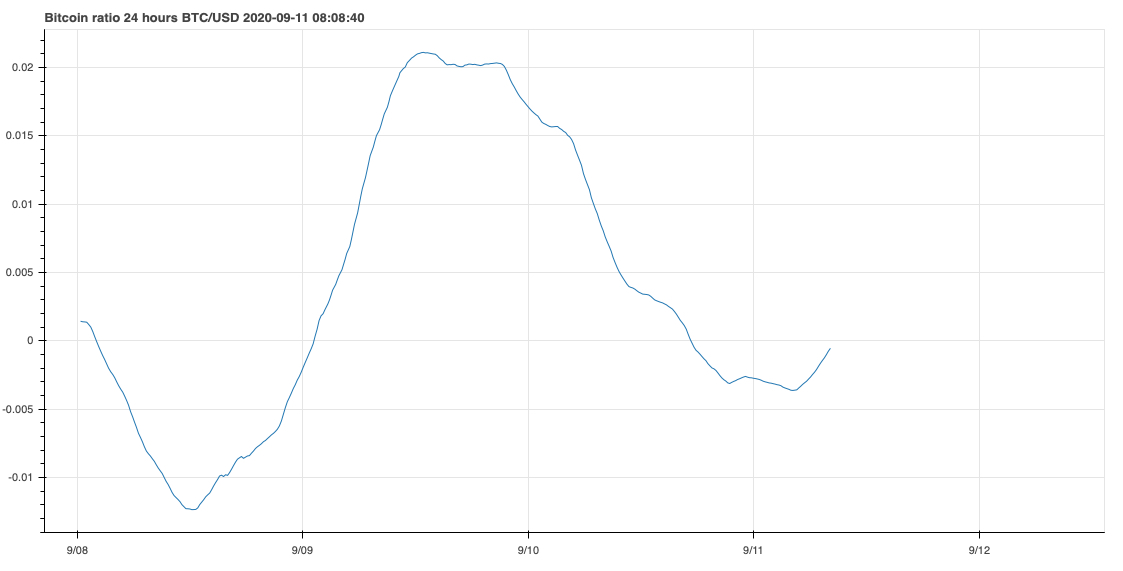
Estimate for the next 24 hours
We also make a prediction for 1 day ahead. The original BTC ratio is shown in the enclosed figure.
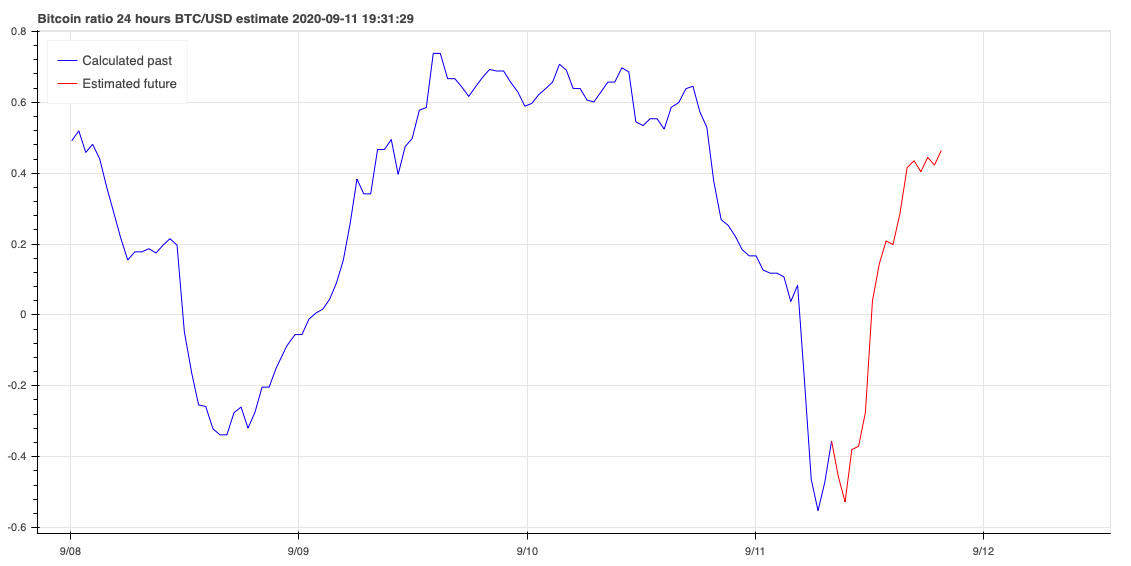
The estimation for the next 24 hours is shown in the figure above. One interesting point is to analyze the overall behavior of the graph; if the graph is positive 24 hours, this should mean that the BTC course on average should go up in the next 24 hours. Also, when the time goes on, the model gets more data and learns itself, and the predictions are more accurate in future.
This algorithm has a set of parameters which are automatically modified during the execution. In addition to that there are some other parameters which can manually be adjusted. Therefore when we find a decent baseline for the estimations, this provides a great starting point for AB testing to improve the results even further. It is also possible to extend the model and, for example, create further graphs for 2h, 4h, .. 36h and 48 hours, and so on. When having different views to the same data set, the possible errors and deviations are easier to detect. Another way to improve the result would be to a fit a line or curve to estimate, optimize the shape and to make a comparison fit to BTC ratio. This would give, for example, the crossing points in a more accurate way. Also, if including some other BTC predicitive data from other sources to this same model, it could provide new additional insight.
Conclusions
We have shown a model that predicts the average BTC course ratio behavior in real-time. At the time when the model was created, it seemed to work quite well (I am not tracking this on daily bases). We used the data publicly available at the internet and the sotware resources that are free of charge. The algorithm learns in time and the results should be more accurate in future. The same algorithm structure can be used for the estimation of other currencies and stock courses as well.
The information presented in this study should not be used as a basis for investment decisions. However, everybody can check by own eyes how the model works and whether it makes sence. Good luck!
More topics on Machine learning.